
Analytics
The Analytics section provides insights into school performance, helping you make data-driven decisions.
Accessing Analytics
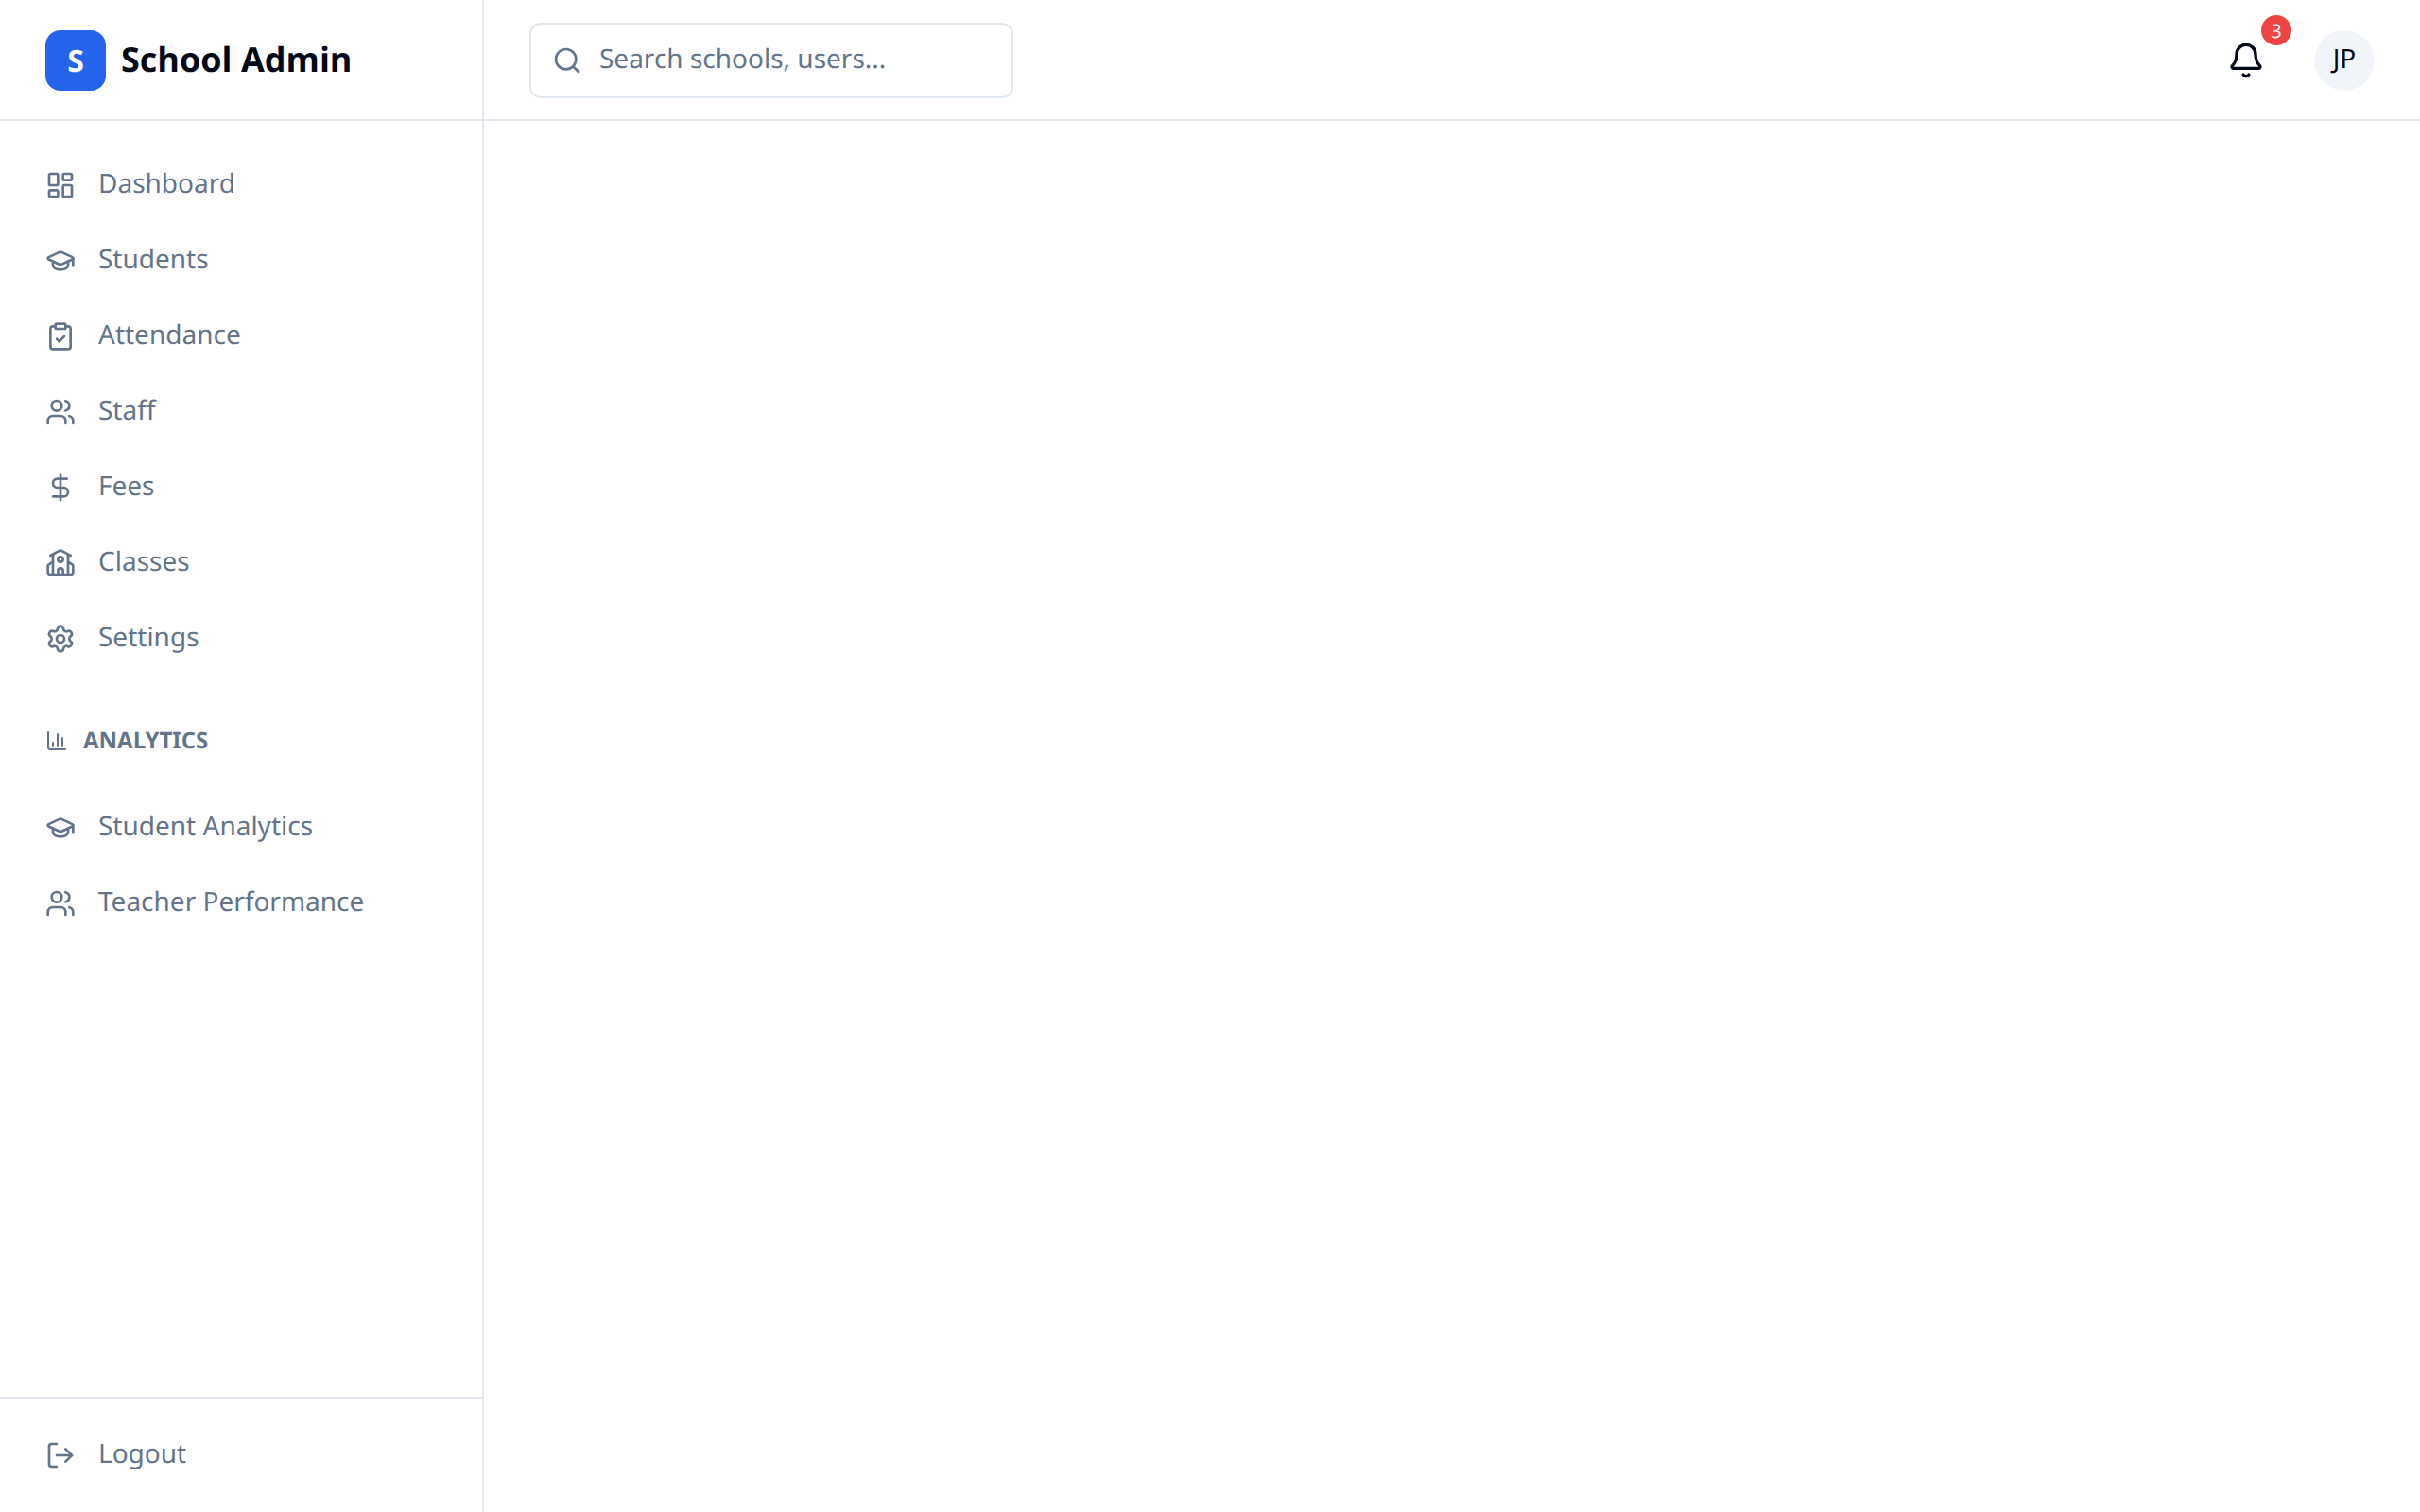
The sidebar has an Analytics heading with three entries beneath it:
- Student Analytics — school-wide student performance
- Teacher Performance — teacher workload and class averages
- Reports — filtered exports and report cards, covered on its own page: Reports
Student Analytics
If the school has no students enrolled yet, this page skips the charts entirely and shows a message inviting you to Add student or Bulk import instead.
Headline figures
| Card | Description |
|---|---|
| Total Students | Currently enrolled |
| Total Classes | Across all grades |
| Avg Grade | The school's average, plus how many students have grades |
| Today's Attendance | Today's present/absent counts as a rate; if nothing's been marked today yet, it falls back to the weekly average |
Averages are pulled in student by student, so the Avg Grade card shows a "loading x/y" note until they're all in.
Grade Distribution
A bar chart bucketing every graded student by their overall average: A (80% and up), B (70–79%), C (60–69%), D (50–59%), F (below 50%). If no student has a grade yet, it says so instead of drawing an empty chart.
Attendance Trend
A line chart of the daily attendance rate over the last month. It needs at least two days of attendance before it can draw a trend.
Top Performers and Lowest Performers
Two lists of five students each — the highest and lowest overall averages, with their admission number and how many grades each average is based on. The eye icon opens that student's detailed analysis. Both lists say "No grades recorded yet" until at least one grade exists.
TIP
Everything here comes from grades and attendance already in the system. If a chart says "No grades recorded yet", that's real — the fix is grade entry, not the analytics page.
If the page fails to load, you'll see a Couldn't load student analytics message with a Retry button rather than a blank screen.
Teacher Performance
If there's no staff on record yet, this page shows a message instead of the stat cards and table.
Headline figures
| Card | Description |
|---|---|
| Total Teachers | Teachers on staff, and how many are active |
| Classes Taught | Total across all teachers |
| Students Reached | The sum of their class rosters |
All Teachers
A table sorted by classes taught, most first:
| Column | Contents |
|---|---|
| Teacher | Name and email |
| Employee # | Employee number |
| Subjects | Their specializations |
| Classes | How many classes they take |
| Students | How many students that reaches |
| Class Avg | Their average, when class averages are switched on |
| Status | Active or Inactive |
| Actions | View opens their detailed analysis |
Use Search teachers... to find someone by name, email or employee number.
Show class averages calculates each teacher's average across their classes. It only appears on staffs of 10 teachers or fewer — above that, the button is replaced by a Class averages disabled badge, because running that calculation across everyone's classes at once is too heavy to fire off in one go.
Class and Subject Analysis
Deeper analysis is reached from a class rather than the sidebar:
- Open Classes and click a class
- Use Class analysis for that class's whole picture across every subject, or Mark sheet for the full marks grid
- On the class's Subjects & teachers tab (or from the subject table inside Class analysis), Analyze on a subject row opens that subject's analysis for that one class
There's also a school-wide view of a single subject across every class that teaches it — open Subjects in the sidebar and analyze a subject from there.
Mark sheet
The mark sheet is a standalone, printable students-by-subjects grid for one class.
- Term and Academic year are optional dropdowns populated from the school's configured terms — leave both blank to include every grade saved for the current term
- If you pick a specific term or year and nothing matches, an amber notice reads: "No marks match this term/year filter. Try 'All terms' — marks are saved against the term selected when they were entered."
- Print sends the grid straight to the browser's print dialog (landscape, no app chrome); Download PDF saves it as a file
Reports
Exporting attendance, grades, fees and student data, plus generating and releasing report cards, all live on their own page. See Reports for the full walkthrough.
Using Analytics
Decision Making
Use data to:
- Identify areas needing improvement
- Allocate resources effectively
- Plan interventions
- Set goals and targets
Action Planning
Turn insights into action:
- Identify an issue from the data
- Analyze the root cause
- Plan an intervention
- Implement changes
- Monitor results
Best Practices
- Review regularly - Check analytics weekly
- Focus on trends - Look beyond single data points
- Take action - Use insights to drive improvement
- Share findings - Communicate with stakeholders
- Track interventions - Measure impact of changes
TIP
Use analytics during staff meetings to discuss performance and plan improvements based on data.