
Analytics
The Analytics section turns the marks and attendance you've recorded into class-level insights, so you can see how a class is doing and who needs help.
Accessing Analytics
- Click "Analytics" in the sidebar navigation
- Pick a class in the dropdown at the top right
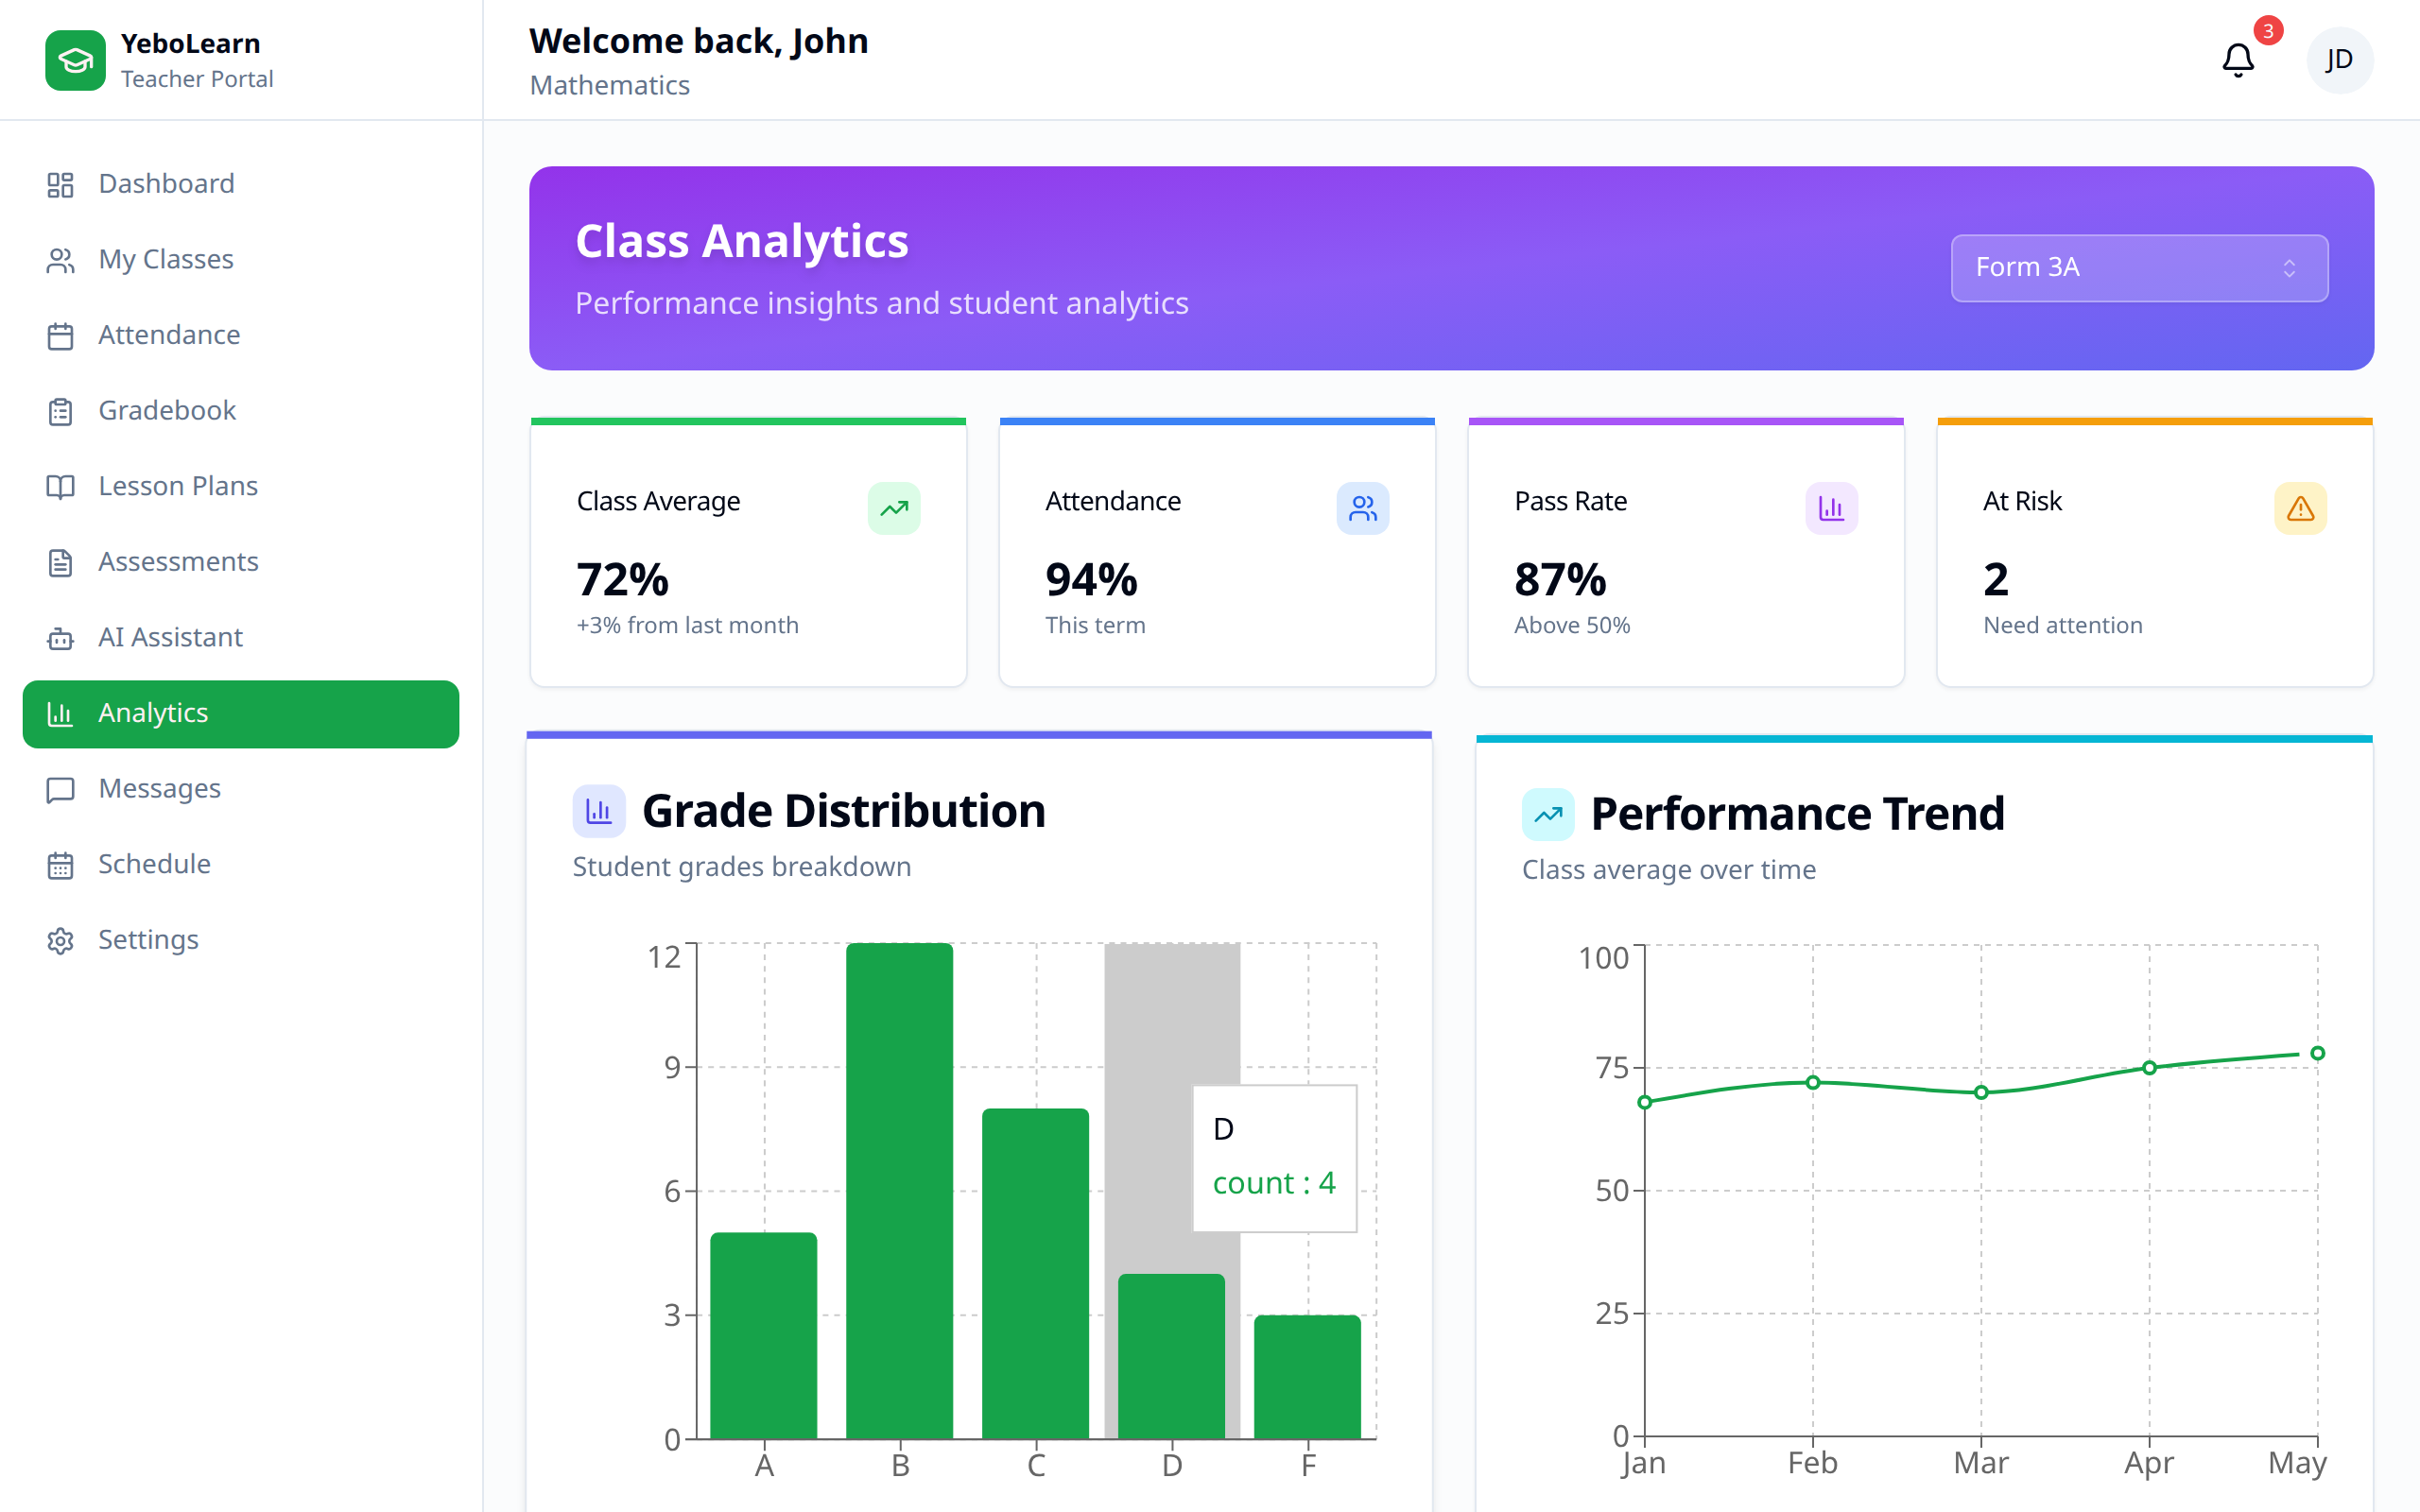
The page is headed Class Analytics and everything on it refers to the selected class. If you haven't entered any marks or attendance for that class yet, you'll see a prompt to start marking attendance and entering grades.
Class Analytics
Headline Figures
Four cards sit across the top:
| Metric | Description |
|---|---|
| Class Average | Average of every recorded mark, as a percentage, with the number of marks below it |
| Attendance | Attendance rate over the last 30 days (present and late both count as attending) |
| Pass Rate | Share of students whose average is 50% or above |
| At Risk | How many students are currently flagged for attention |
Grade Distribution
A bar chart bucketing each student's average into A to F:
| Band | Average |
|---|---|
| A | 80% and above |
| B | 70–79% |
| C | 60–69% |
| D | 50–59% |
| F | Below 50% |
If no marks have been entered, the chart says so instead of showing an empty graph.
Performance Trend
A line chart of the class average per month, over the last six months with marks. It needs at least two months of marks before it can draw a trend — until then it tells you so.
At-Risk Students
The At-Risk Students list flags students with an average below 50% or attendance below 80% over the last 30 days.
Each entry shows:
- The student's name
- A High Risk or Medium Risk badge — High means both marks and attendance are a problem
- Their grade average and attendance percentage (or "No grades" / "No records" where nothing has been recorded)
- The reasons: Low grades, Frequent absences, or both
If nobody qualifies, the list reads "No students currently flagged as at-risk."
Exporting Reports
- Click "Export" at the top right
- Choose what to download:
| Report | Formats |
|---|---|
| Grades report | PDF, Excel, CSV |
| Attendance | CSV |
The export covers the class currently selected.
Using Analytics Effectively
Inform Teaching
Use the figures to:
- Spot topics that need re-teaching when the class average dips
- Adjust pacing
- Focus attention on the at-risk list
Parent Communication
Bring specifics to conversations with parents — a student's average and attendance percentage from the at-risk list, and their marks from the Gradebook.
Best Practices
- Review regularly - Check analytics weekly
- Enter data promptly - The figures are only as current as the marks and attendance you've saved
- Act on the at-risk list - It's the fastest way to catch a struggling student
- Look for patterns - Use the trend chart across the term, not just week to week
- Celebrate success - Recognise improvements as the trend line rises
TIP
Use analytics to prepare for parent-teacher conferences with specific, data-backed insights about each student.